About the Project
The project was completed as part of a semester-long advanced data visualization class as part of my Master’s Degree in Library and Information Science.
Project Goals
This project was designed with the goal of establishing a reproducible data pipeline which could be applied by public librarians to assess their institutions' collections, in the hope of fostering insights which can be applied to collections development activities. As more and more cultural heritage institutions shift toward making their collections’ metadata publicly available for research, frameworks for potential applications for metadata can prove increasingly useful. While academic libraries have increasingly established positions for librarians with specialties in digital humanities, data, and oftentimes incentivize librarians to conduct research as part of their roles, public libraries typically lack similar positions and research responsibilities. Thus, this project attempts to make all processes explicit in order to illustrate potential approaches to a similar project at under-resourced institutions.
As an exploratory case study to establish a data pipeline for the project, I analyzed metadata about popular books available on Goodreads. Goodreads users are a specific community- as such the data collected in the project is not validly representative of all readers in the U.S. or a generalized audience.
Metadata Collection
The goal of the project was to develop a data pipeline which could be used to explore common themes in popular books on Goodreads. In order to limit the scope of the project, I chose to analyze metadata from books which were nominated for the Goodreads Readers’ Choice Awards from 2011-2024. Per the awards’ rules for eligibility, each year of eligibility lasts from early December of the prior year to the end of November in the year of eligibility (for example, to be eligible for the 2024 awards, books must have been released between November 16, 2023 and November 12, 2024). Goodreads analyzes statistics about the books which are published in each year of eligibility in order to determine nominations, and requires books to have an average rating of at least 3.5 at the time of nomination. Thus, the books in the awards represent some of the popular books published each year, but the awards do not include data about books which are consistently popular or experience a surge in popularity after their release year.
Between ~300 and ~440 books are nominated for the awards each year, although the exact number has varied between years (see table 1).
Table 1
| year | number of categories | original number of books | deduplicated number of books |
|---|---|---|---|
| 2024 | 15 | 300 | 272 |
| 2023 | 15 | 299 | 284 |
| 2022 | 17 | 340 | 320 |
| 2021 | 17 | 340 | 323 |
| 2020 | 20 | 399 | 381 |
| 2019 | 20 | 400 | 384 |
| 2018 | 21 | 420 | 385 |
| 2017 | 20 | 400 | 390 |
| 2016 | 20 | 400 | 393 |
| 2015 | 20 | 400 | 390 |
| 2014 | 20 | 399 | 392 |
| 2013 | 20 | 400 | 391 |
| 2012 | 20 | 399 | 379 |
| 2011 | 22 | 440 | 401 |
The nominated books are sorted into a series of categories, which have changed over the years of the awards’ existence. For example, in 2024, an audiobook category was added, and in 2022 the middle grade/children’s category was phased out (figure 1). Following exploratory analysis of the metadata, I deduplicated books which were nominated for multiple categories.
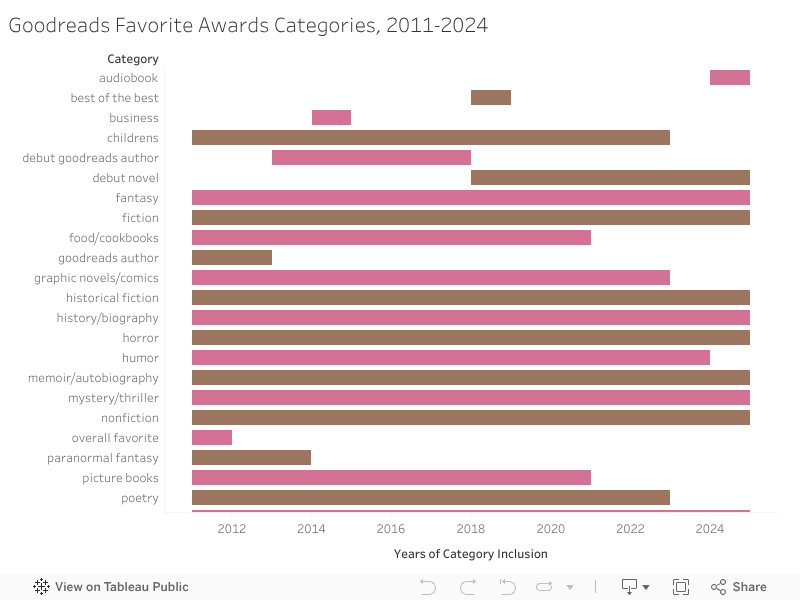
Across the studied time period, a number of categories were removed or modified. The visualization below is interactive- hover over the bars to view category names.

An alternate visualization of the awards categories over the studied time period.
In terms of metadata used for the analysis, I chose to analyze fields which have corresponding fields which a public library would typically catalog. For a potential mapping of the metadata used in this project to public library collection metadata see table 2.
Table 2
| Goodreads Metadata | Library Metadata |
|---|---|
| Inclusion in Goodreads Favorite Awards | Annual Circulation Count |
| Title | Title |
| Goodreads id | (book id, determined by the institution)? |
| Author | Creator |
| Genre | Subject Terms |
| Description | Abstract, as applicable |
| Category of Awards | Call Number |
While Goodreads collects data about users’ perspectives on books in the form of ratings and reviews, I chose not to include review and rating data so as to 1) avoid using user data without informed consent and 2) establish a data pipeline which corresponded to metadata collected at public libraries, which typically do not collect review style data from patrons, and often do not retain patron borrowing data to protect patron privacy.
Project Pipeline
In order to collect the metadata required for this project, I first wrote web scraping scripts in python which could collect book metadata from Goodreads. My project took significant inspiration from The Goodreads “Classics”: A Computational Study of Readers, Amazon, and Crowdsourced Amateur Criticism by Melanie Walsh and Maria Antoniak, which had previously developed a web scraper for a similar project, published on GitHub. However, as of the time I conducted my project, the scripts used for the project were no longer functional (largely due to changes in the structure of Goodreads’ book pages). Given the likelihood that the scripts I developed for this project will likely soon become obsolete, due to the nature of web development and web scraping, I chose to document the purpose of the functions I wrote for the project, in order to facilitate methodological replication.To explore the code for this stage of the project, see the project GitHub page.
In my initial pass, I collected book titles, genre tags and description fields. I subsequently manually added year of nomination, and awards category fields, added fields for book ids and to account for the “initial order” in which the books were pulled (to facilitate data sorting) and wrote an additional script to gather author names.
Facet analysis of the data in OpenRefine revealed that there were no null values in the data set, and that the metadata was overall complete and accurate. In a similar project, further tidying and remediation of the metadata would likely be necessary prior to continuing with the analysis.
However, as previously noted, a number of books appeared multiple times in the dataset, primarily due to their inclusion in categories such as “the best of 2011”, “best audiobooks” or “debut novel”, in addition to thematic categories such as “romance” or “horror”). For example, in 2024, How to End a Love Story by Yulin Kuang was nominated for both Favorite Romance Books and Favorite Debut Novel. Rather than removing all books in the frequently duplicated categories, I chose to deduplicate the stories which were nominated for multiple categories (noting all categories for which they were nominated in a separate column) to retain data about the books which were solely nominated as debut novels or audiobooks.
Data Analysis Methods
The manageable size of the dataset (5336 original records, 5085 following deduplication), allowed me to conduct data clean up in Google Sheets and OpenRefine. In order to enable analysis of the subject terms assigned to each book, I began by writing regular expressions to identify the presence of the top 200 subject terms identified in the nominated books. I determined the top 200 subject terms using text facet analysis of the genre field (separated into columns and transposed) in OpenRefine.
In order to uniquely identify each subject term I followed the below formula, which allowed for uniquely identifying each term.
=REGEXMATCH (C2, "^Term,|, Term,|, Term$")
In many cases using a simpler expression, would result in misidentification of certain terms. For example, the expression:
=REGEXMATCH (C2, "Fiction")
would also identify “Historical Fiction” or “Contemporary Fiction”. In contract, the specific expression I used
=REGEXMATCH (C2, "^Fiction,|, Fiction,|, Fiction$")
Uniquely identifies the term “Fiction” by taking advantage of the comma separated nature of subject terms in the genre field.
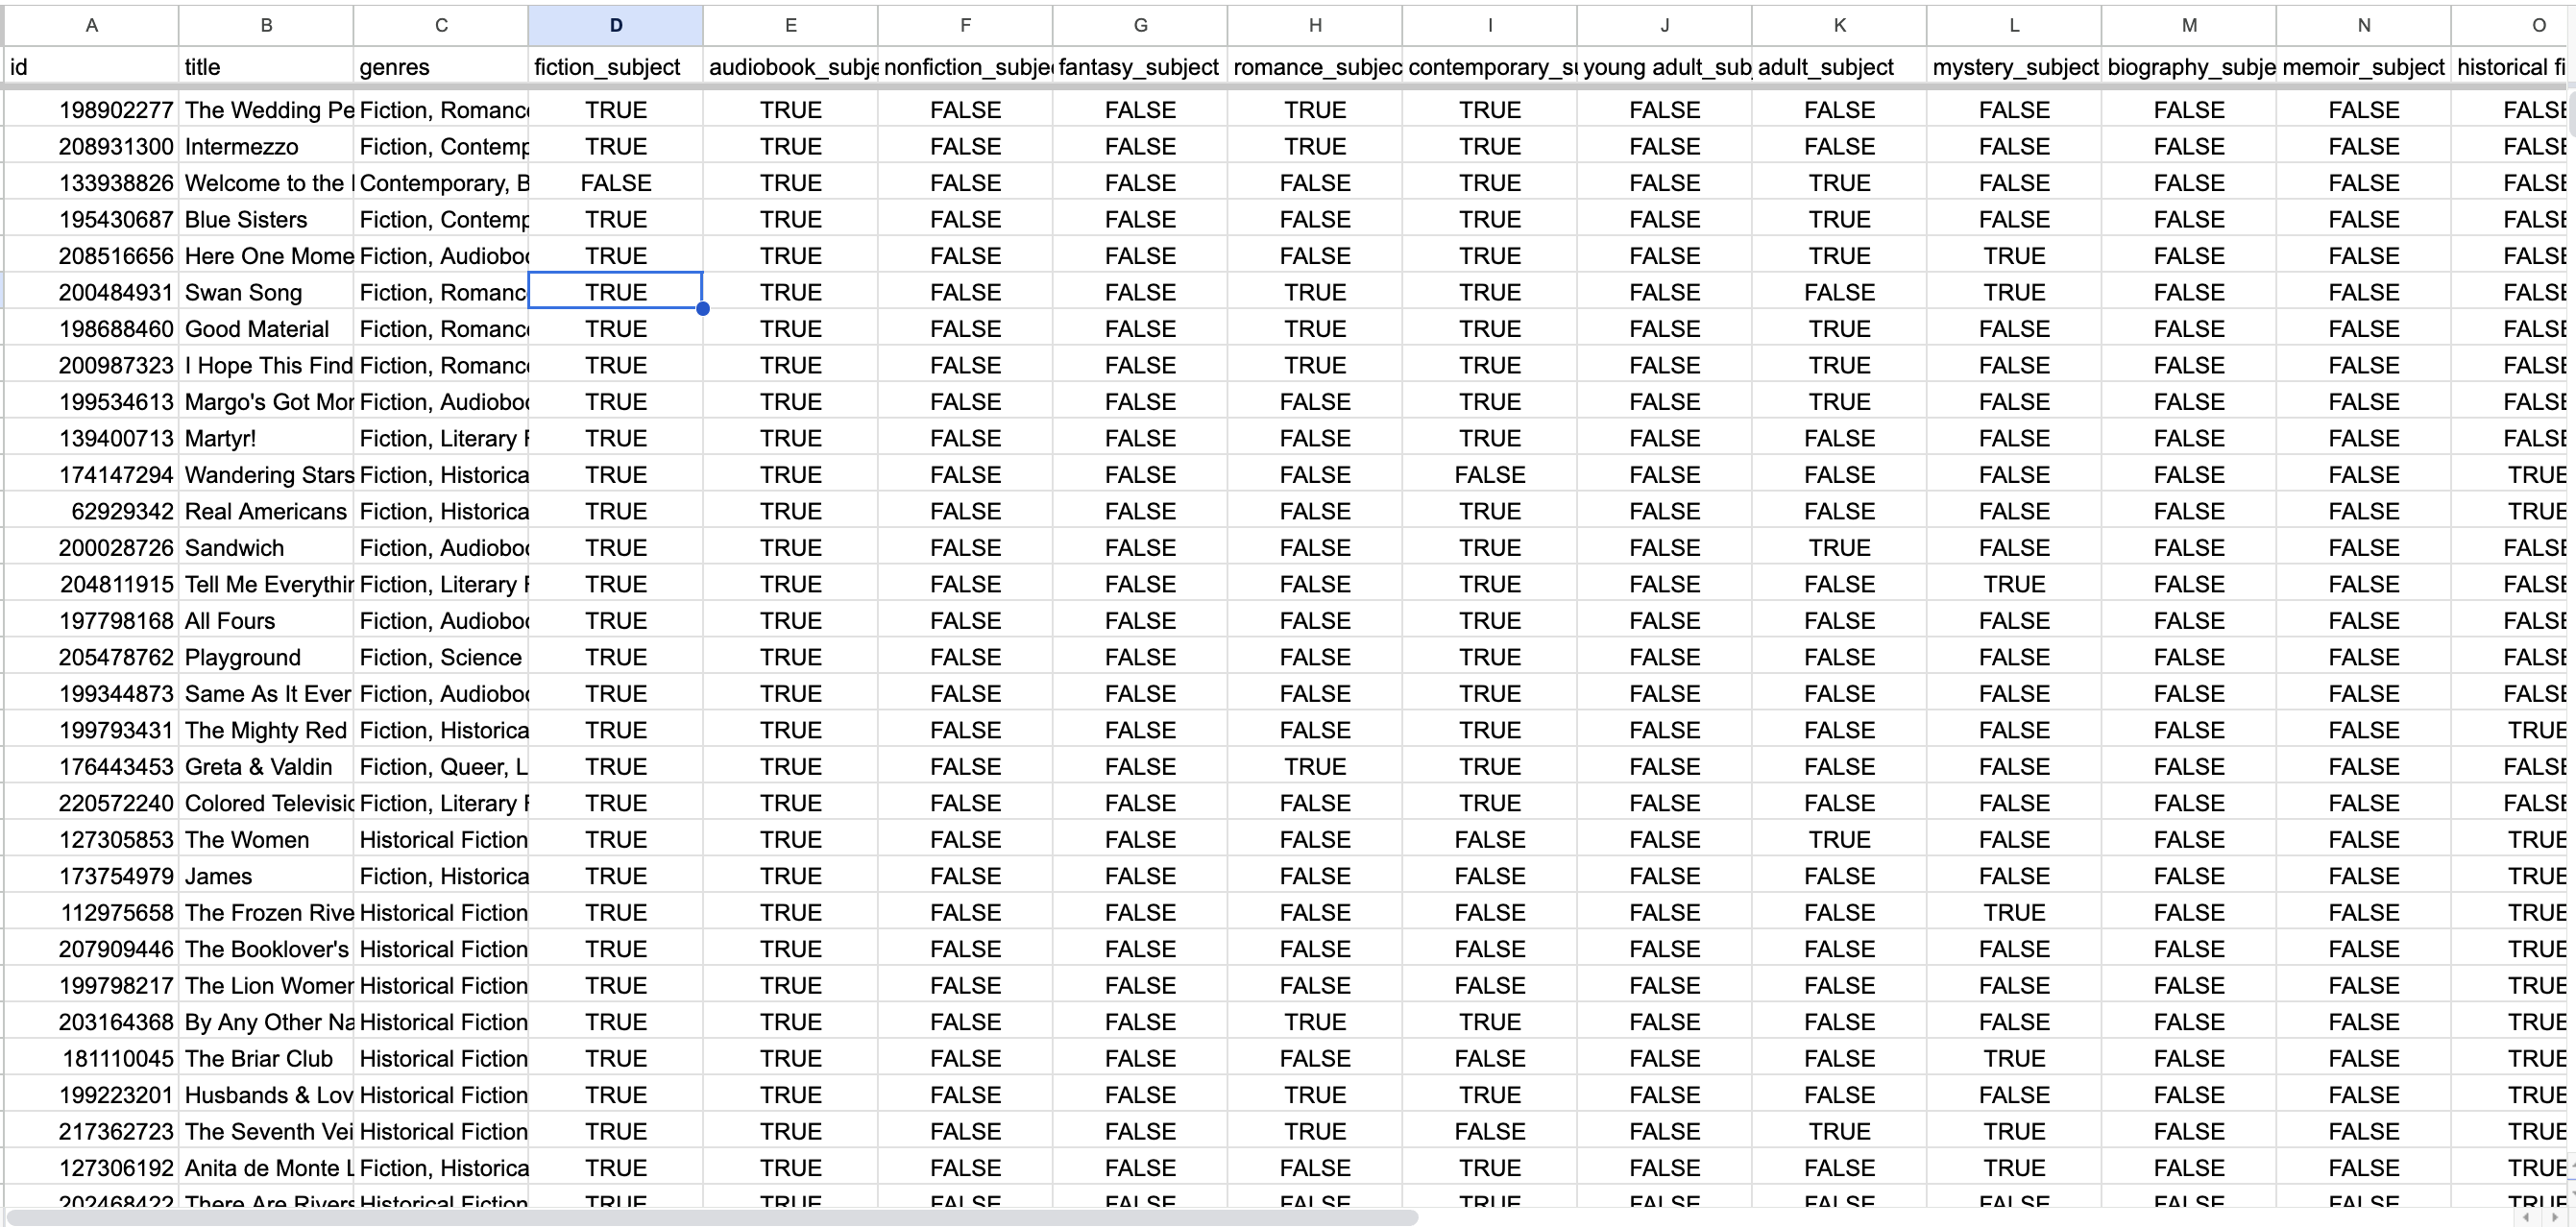
Spreadsheet holding regex functions identifying the presence of the top 200 subject terms in the collection
Upon collecting data on the inclusion of each of the top 200 terms in each books’s genre tag list, I converted the data about each book’s subjects to simple binary values in a new spreadsheet using a simple find and replace (0 for False and 1 for True), and conducted calculations to determine the number of books which were tagged in each category in each year.
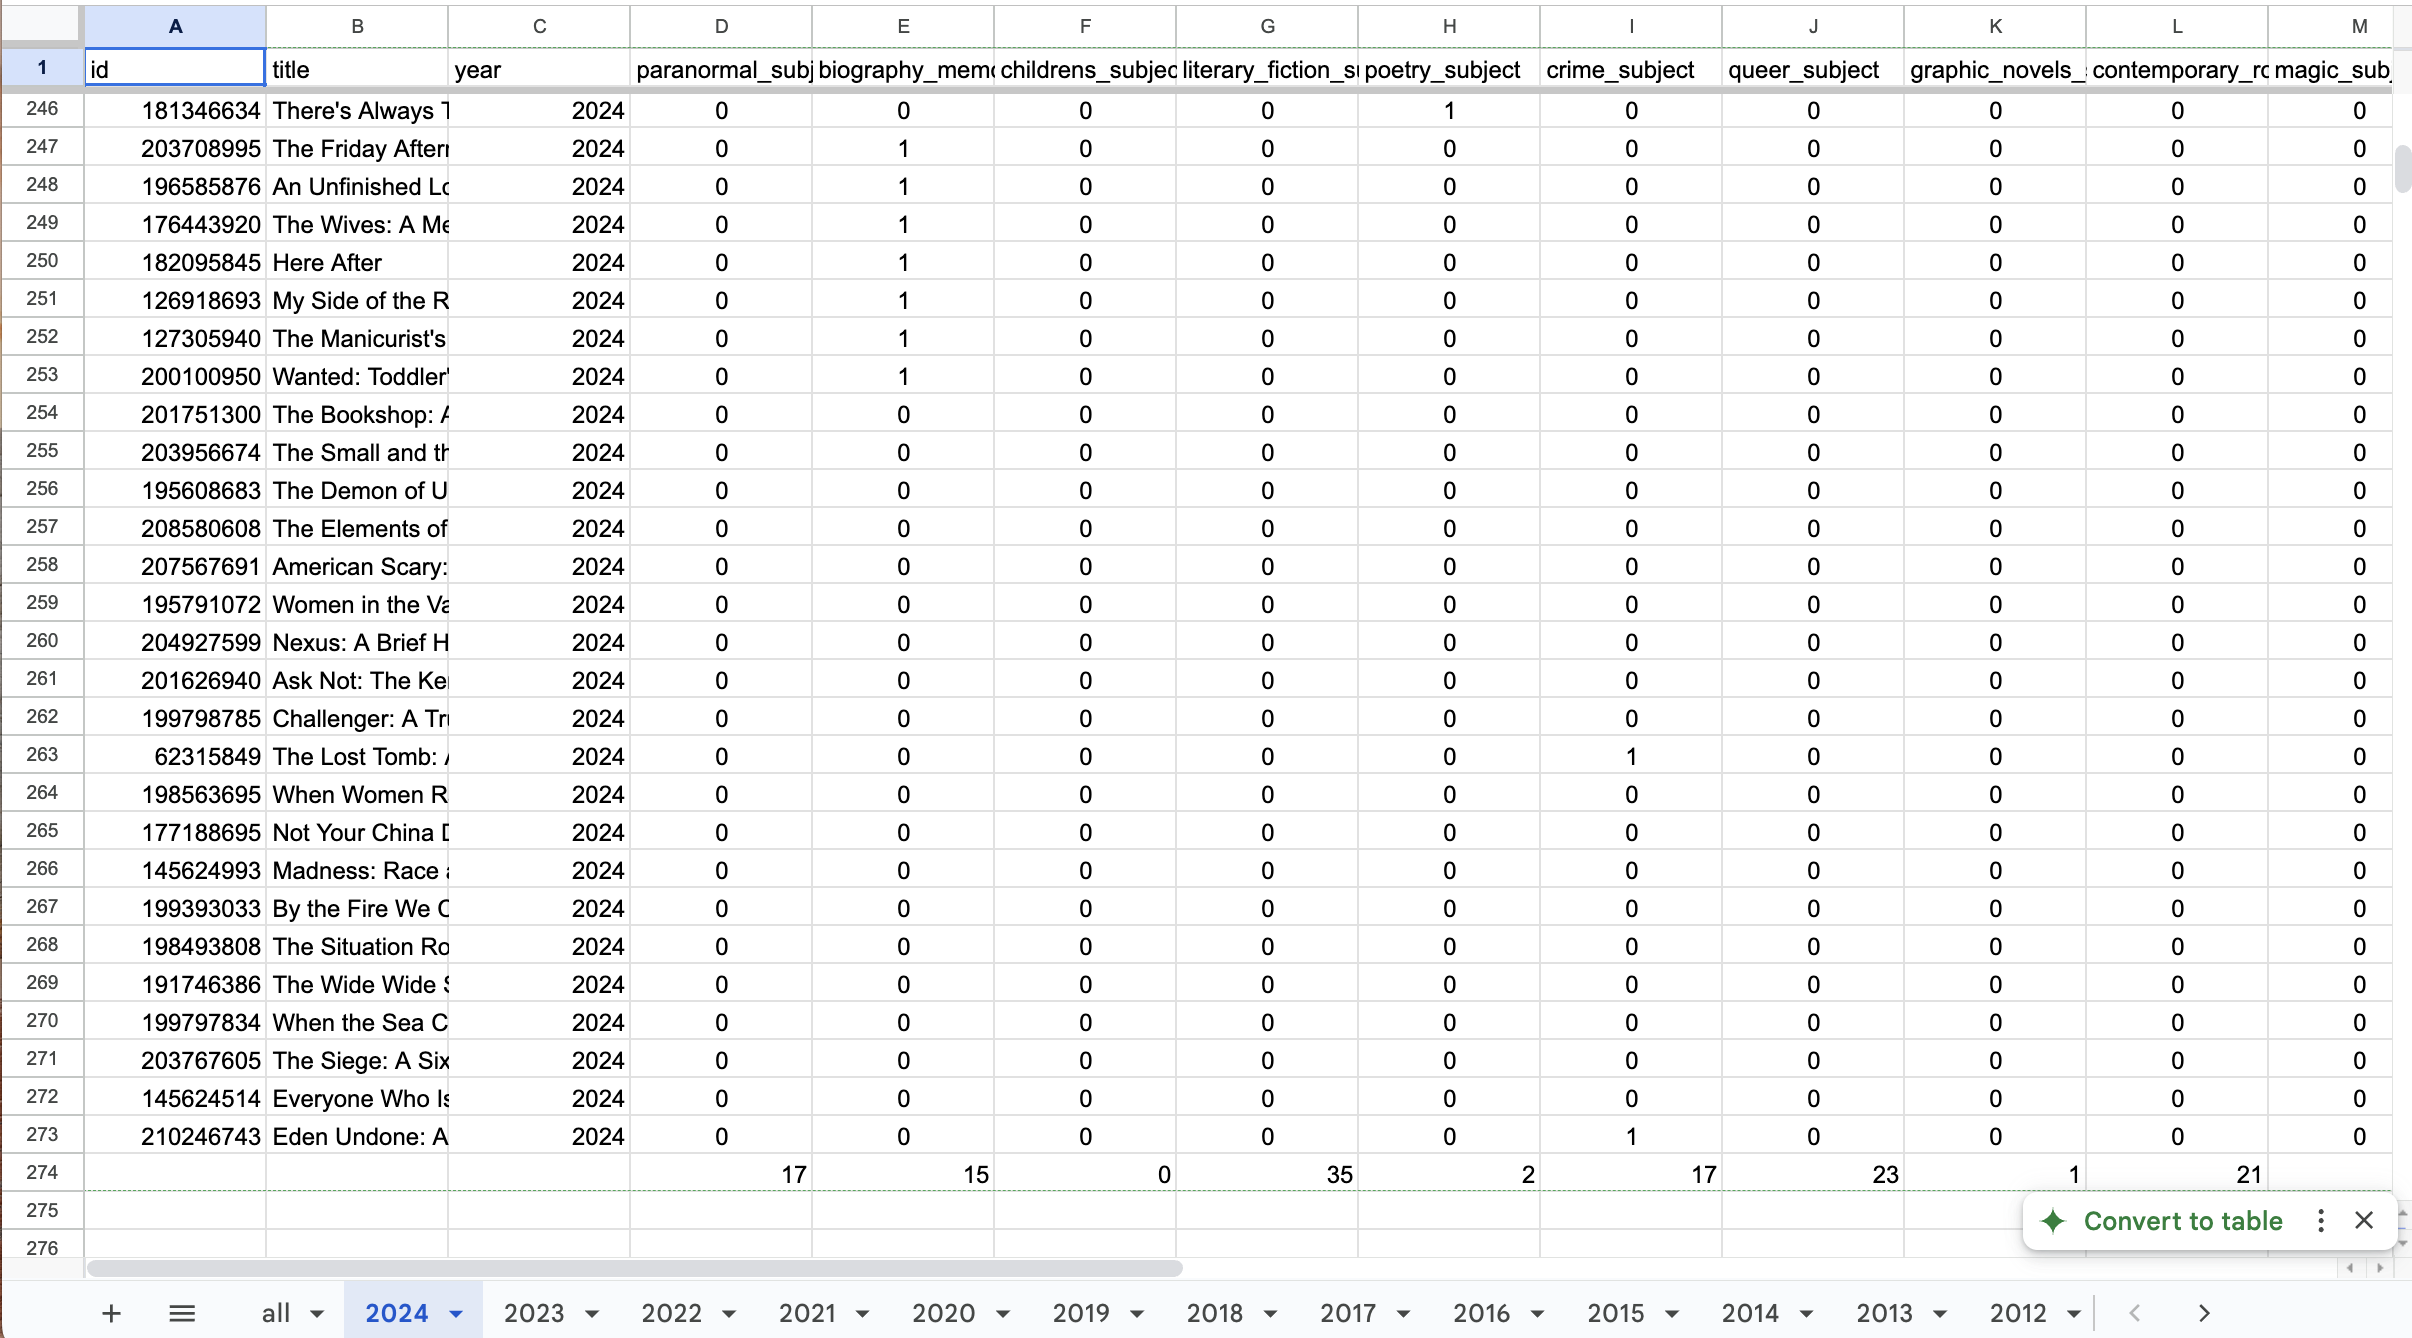
Data converted to binary values
In order to express the data as line charts, I calculated the percent of books which were tagged with each genre by dividing the number of books with the tag in each year from the total number of books in that year.
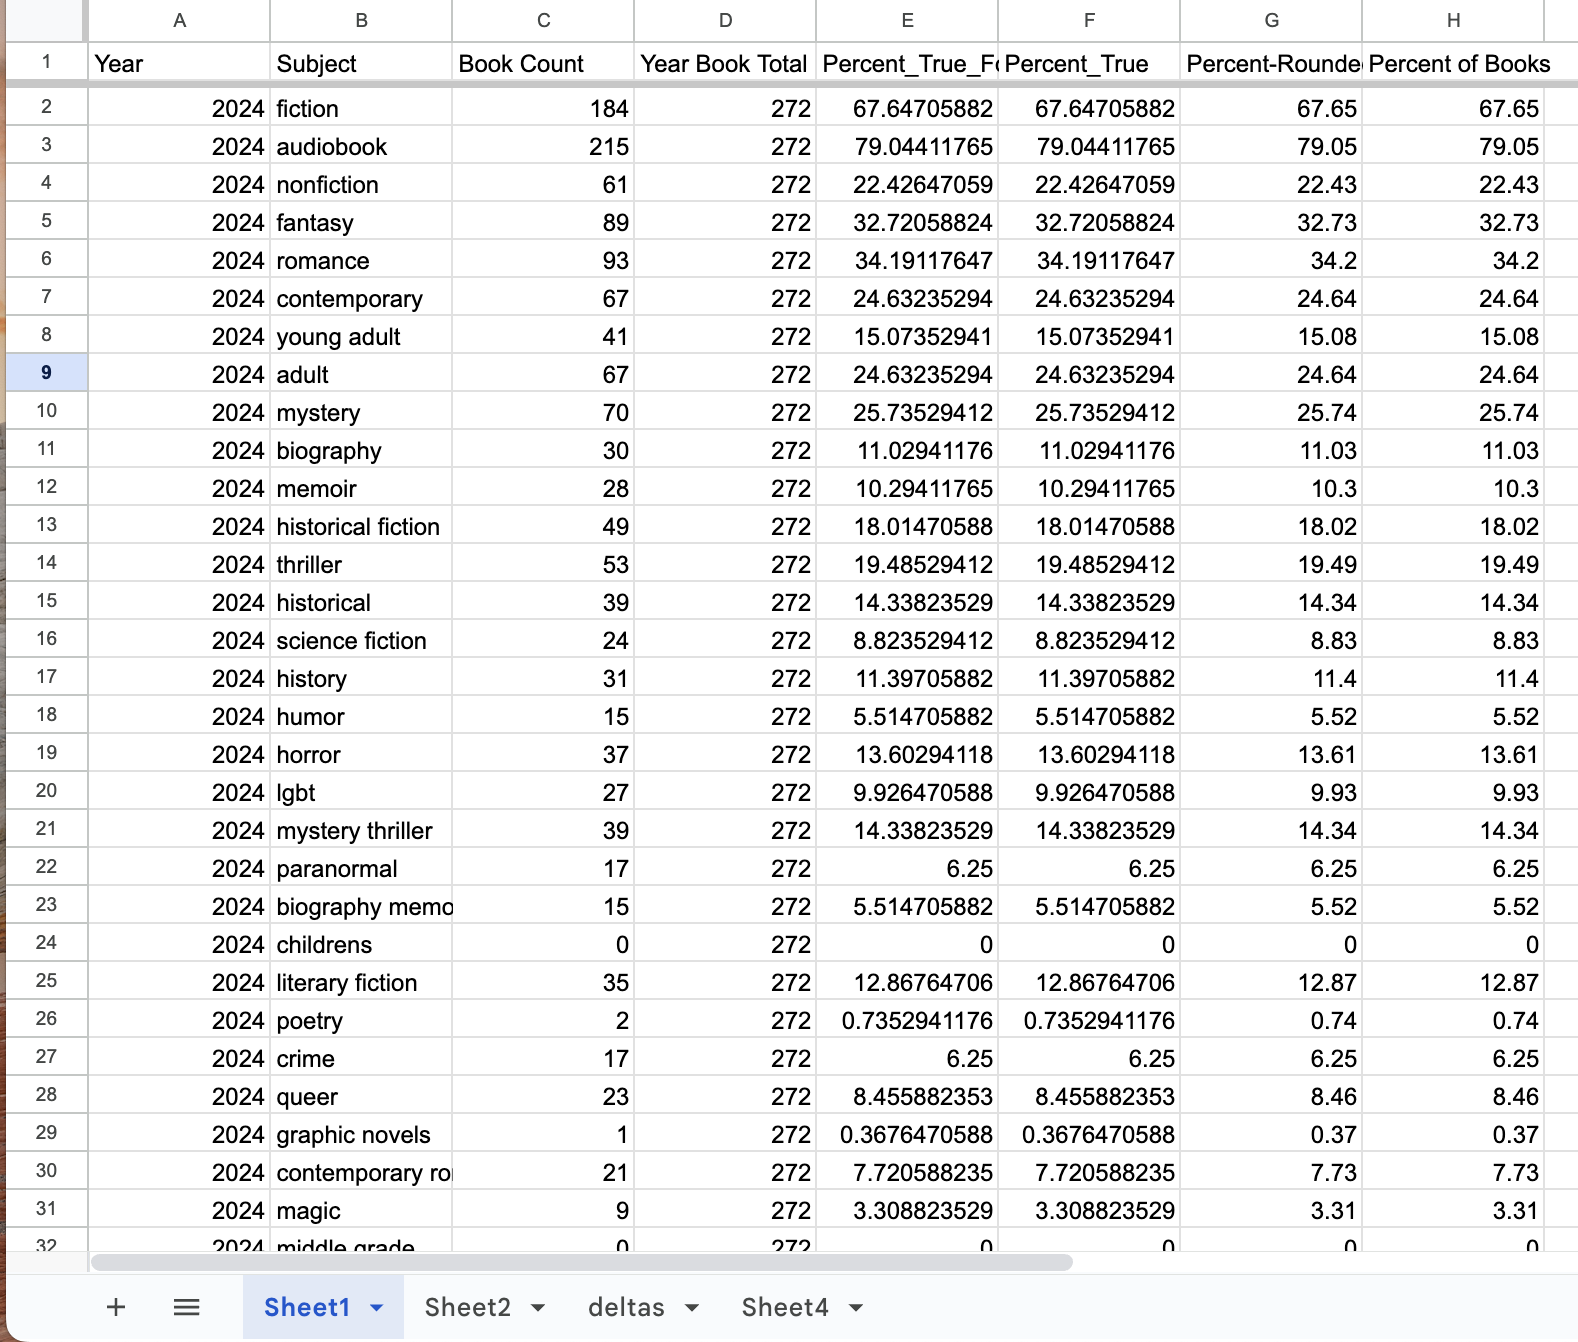
For example, in 2024, 184 books were tagged with the genre “fiction”. 272 unique stories were nominated for the awards in 2024. Thus the percent of books with the fiction tag (rounded to the second decimal for legibility) in 2024 was 67.65%.
The binary data I collected about the assignment of each genre tag to the books was also useful for calculating simple correlations between topics or book categories and topics, to explore relationships between topics. This was accomplished in Python, using simple scripts, and the libraries pandas and SciPy.
The datasets collected for the project, and tutorials for how to replicate this analysis are available via the project GitHub page.
As a note, subject terms (called “genres” on Goodreads) can be a particularly useful tool for exploration of the topics included in a collection. However there are limitations to their use as a reflection of materials’ topics; subject term tags are designed to facilitate discovery in a large database of materials, rather than describe plot points. Additionally, the language used in subject terms is reflective of the cultural context, norms and expectations in which the terms are created. For example, the choice to tag a book as “lgbt” versus “queer” may reflect changing practices in semantic expressions of queerness just as much as the content of the book itself. However, for the purpose of metadata analysis, exploring trends using subject terms can still yield valuable insights about broad content themes of a collection and the ways in which a collection has been described by staff responsible for writing and sourcing metadata. In this way, metadata analysis can also help highlight interesting semantic choices made by book catalogers, and potentially even facilitate reparatative metadata work by highlighting terminology which can be updated.
Findings Vignettes
In order to demonstrate potential opportunities for exploration enabled by metadata analysis in this context, I chose to create a series of “vignettes” exploring various trends, to illustrate some of the findings and assessment which could be made using the collected data.
Declining interest in vampire books
For example, data about the presence of books about various occults indicates that interest in books about vampires steadily decreased following a 2011 peak. Interestingly, the final Twilight movie was released in 2012- thus a steady decrease in the number of vampire books nominated for the awards since that time period seems intuitive. In this case, a collection development librarian may want to avoid purchasing a large number of new books about vampires, werewolves or zombies for their community's collection.

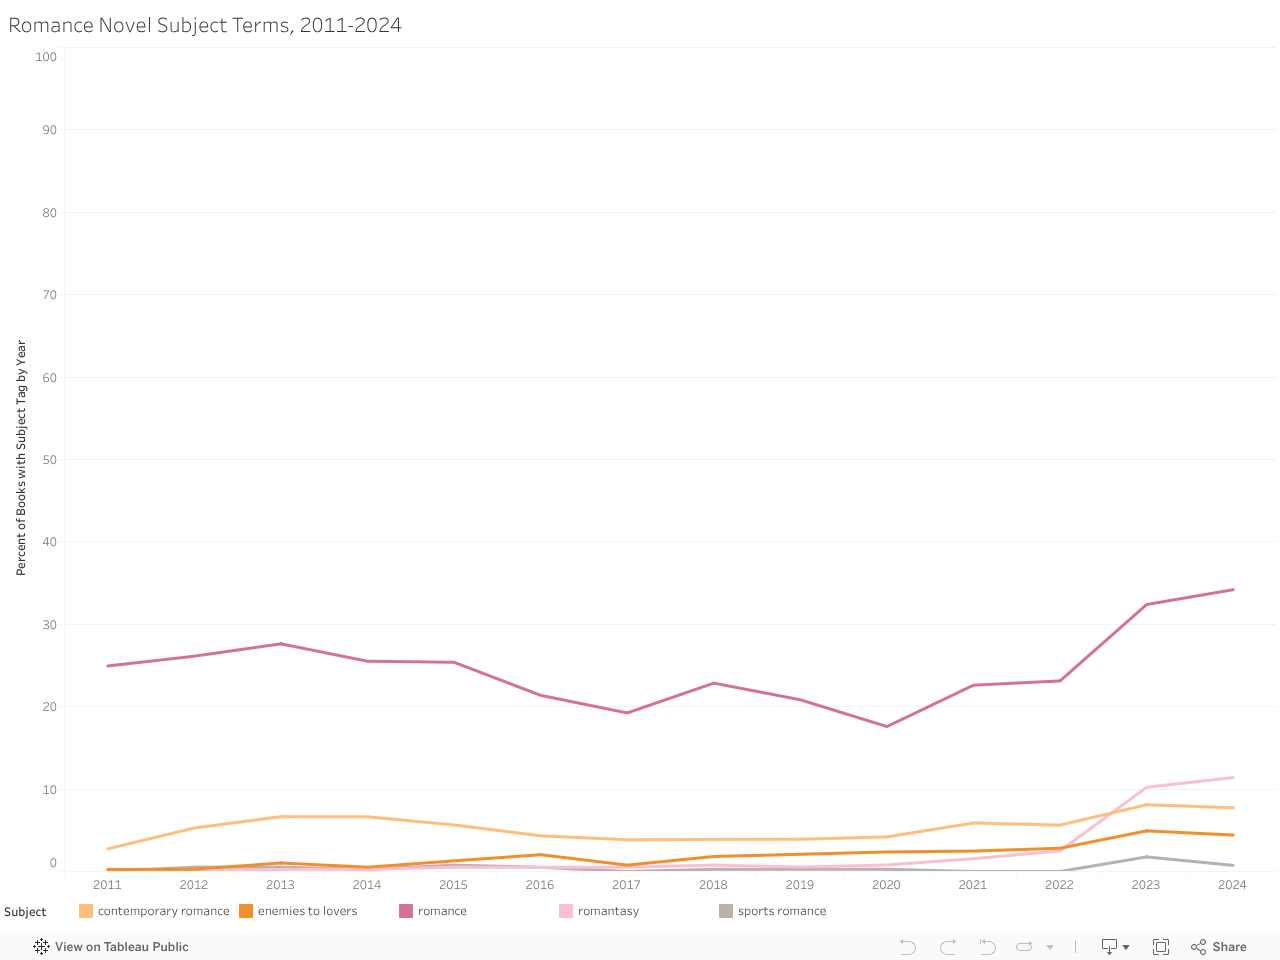
Shifts in the Popularity of Romance Novel Subgenres
Prior to commencing this project, I saw an interesting video on social media, in which the creator alleged that rising interest in romance novels was responsible for the revitalization of Barnes and Nobles stores. There has been a relatively steady increase in the percent of books in each year tagged as romances from 2011 to 2024. However, this shift may be in part due to the changes in awards categories created by Goodreads. For example, in 2023 the awards removed several categories, including Poetry, and Childrens, but added a Romantasy category to the awards. This change is also likely contributing to the increase in books tagged as Romantasy in 2023. However, overall romance novels are persistently popular for this community and thus are an important part of the collection.
Shifts in focus on social justice in the highly circulating collection
In some cases, assessment of the findings drawn from the dataset may require more nuance. For example, when assessing subject terms related to anti-racism and social justice, there was a spike in popularity of books explicitly addressing those topics in 2020. However, the subsequent decline in frequency of those tags may not reflect the persistence of community interest in this subject matter. First, this project does not track the persistence of a book's popularity over time- rather the data associates the subjects of the book with the year in which it was published. Second, intervening factors (such as increases in booklists and resources hihlighting books about social justice and anti-racism) may have contributed to this spike. Thus, in order to assess whether or not the Goodreads community is continuously interested in books with this subject matter would require further investigation into the interests of the Goodreads community.

Using Correlation to Identify and Assess Interesting Trends
Correlation coefficients are a tool which can identify relationships between tags for the project. For example, in the Goodreads data collection, intuitively, there is a strong positive correlation between the LGBT and queer genre tags, a small inverse relationship between the war and cookbooks tags, and a strong positive correlation between whether a book is included in the "best cookbooks" category and whether it is tagged with the "cooking" genre tag.
From a metadata perspective, this type of analysis can help identify potential issues in the assignment of genre tags. For example, a librarian working with this collection may want to adjust tags so that all books tagged as "LGBT" are also tagged as "queer", given the synonymous nature of those terms.
| Fields | Correlation | P-value |
|---|---|---|
| lgbt, queer | 0.8166515870289031 | 0.0 |
| war, cookbooks | -0.038032679821485824 | 0.006679914902734242 |
| cooking category, cooking | 0.8941807186296845 | 0.0 |
The above p-values are written using scientific notation. Values less than 0.05 are considered statistically significant. In the case of this project, all calculated correlations are considered statistically significant.
Overall Findings- significant difference in the changes between topics across the years
As metadata analysis and tools which rely on data to conduct advanced computational analysis, including Artificial Intelligence, become more popular in library workflows, one important point of assessment for the project was the degree to which the trends the project identified shifted across the studied period. I hypothesized that a high degree of variation in subject-matter trends would indicate the need for caution when applying metadata analysis to collection development. This caution is necessitated by the reality that the data collected for the project provides a snapshot of the interests of the Goodreads' community of readers in the past. However, a low degree of variation in trend rates could indicate that collection development librarians could reliably rely heavily on data or even artificial intelligence to inform future collection decisions. However, in reality, analysis of the degree to which topic trends changed from 2011-2024 showed a high degree of variation. For example, between 2011 and 2024, 7.93% more of nominated books had the LGBT genre tag, while the adventure and nonfiction genre tags decreased by 7.25%. This data was collected by comparing the percent of nominated books which had a given genre tag in 2024 and 2011.
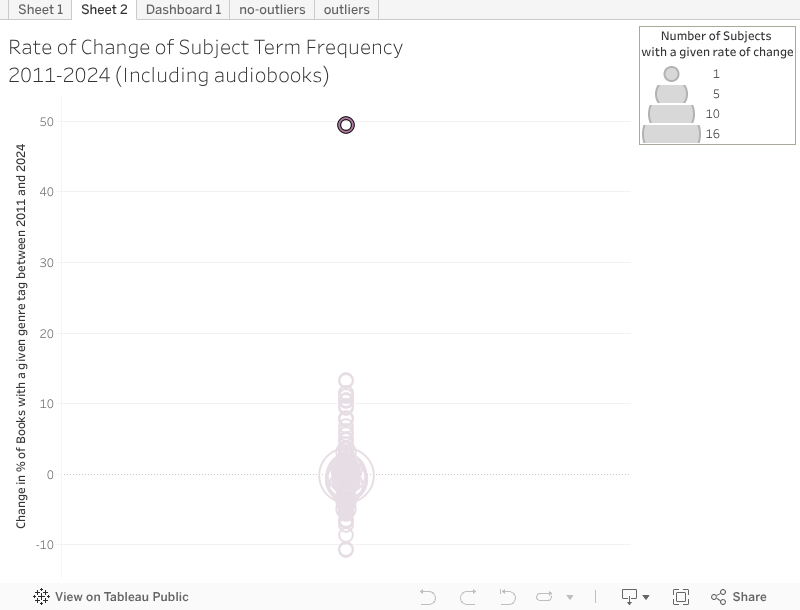
The audiobook genre tag (which is used to indicate that a book has an available audiobook version) was a significant outlier in this analysis- the percent of nominated books tagged with "audiobook" grew by almost 50% between 2011 and 2024.
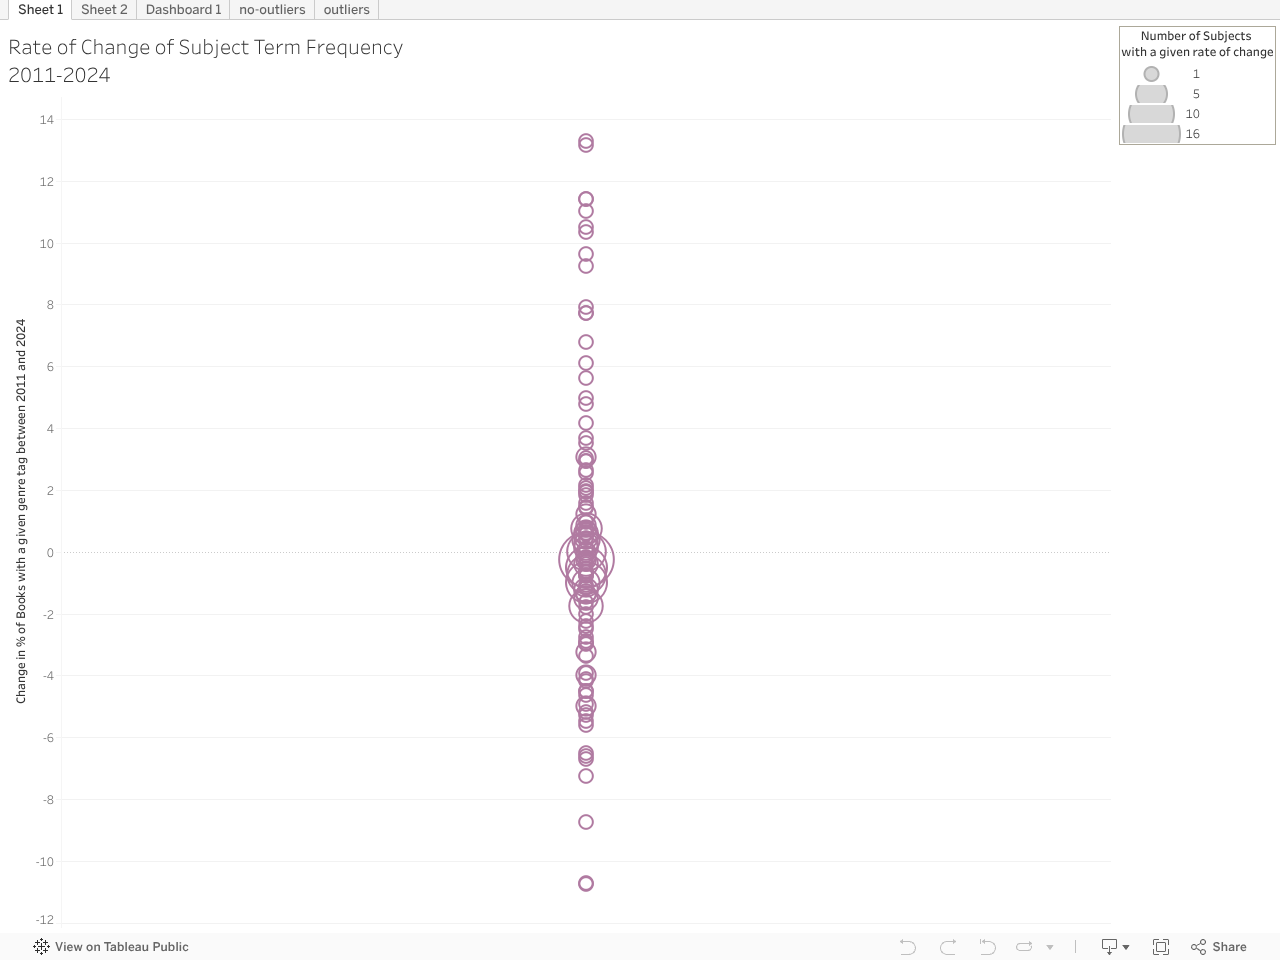
Changes in Topics without Outliers
Additional Visualizations for Exploration
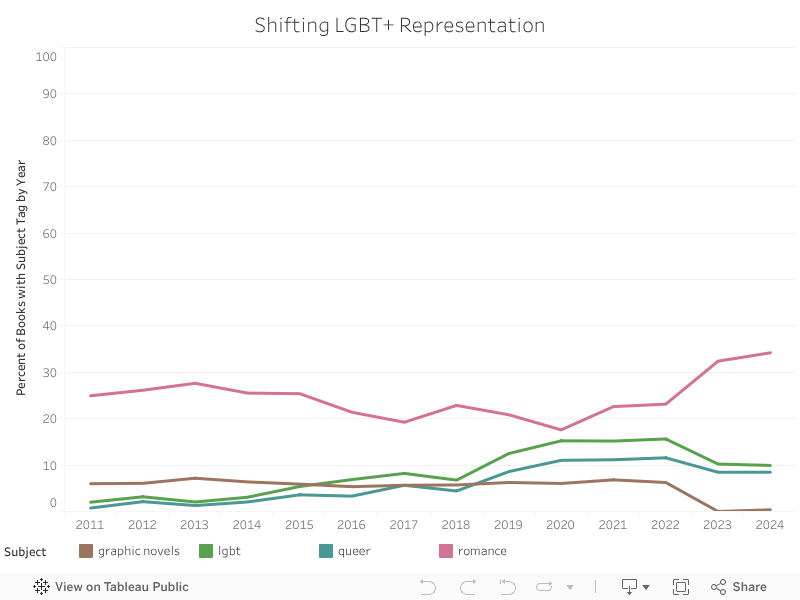
Representation of Queerness in the Collection
As books by and about Queer people (as well as Black and Indigenous people) are increasingly targeted for book challenges, I was also interested in exploring changes in the percent of books with LGBT or Queer genre tags. Interestingly, in 2022, there was a slight decrease in nominations for books tagged as LGBT or Queer. Based on the below figure, it appears that this decline is similar to the decline in books tagged as graphic novels. In 2024, Goodreads removed the specific graphic novels category from the awards, likely contributing to the decline in the percentage of books with that tag. However in order to assess the strength of this hypothesis, I analysed the correlation between the graphic novel and LGBT tags. As previously noted, the majority of books tagged as LGBT are also tagged as Queer, thus I chose to treat the values as interchangeable for this analysis.
There is a slight positive correlation between the tags, however this change alone likely cannot explain the change in representation of Queer stories in the awards. Another interesting correlation was the relationship between the romance and LGBT tags- here I was interested in whether or not the majority of books explicitly about LGBT people were romantic in nature. Interestingly, there was a slight positive correlation between the romance and LGBT tags.
| Fields | Correlation | P-value |
|---|---|---|
| lgbt, romance | 0.0615544229845321 | 1.12063878632218e-05 |
| lgbt, graphic novels | 0.07252166281769894 | 2.2547387957731276e-07 |
The above p-values are written using scientific notation. Values less than 0.05 are considered statistically significant. In the case of this project, all calculated correlations are considered statistically significant.
What, exactly, is "chick lit"?
One frequently used genre tag which stood out to me during my analysis was "chick lit". In correlation analysis, I found a positive relationship between the chick lit and romance genre tags, however at ~0.24, this relationship does not fully explain the purpose or inclusion of the term. In other words, not all of the books tagged as "chick lit" are romance novels. Interestingly, there is a slight inverse relationship between the chick lit tag and feminism, indicating that books tagged as feminist were somewhat less likely to be tagged as chick lit.

| Fields | Correlation | P-value |
|---|---|---|
| romance, chick lit | 0.24207674090157905 | 1.0216723562656838e-68 |
| chick lit, feminism | -0.03330097011877499 | 0.017561322285696755 |
The above p-values are written using scientific notation. Values less than 0.05 are considered statistically significant. In the case of this project, all calculated correlations are considered statistically significant.
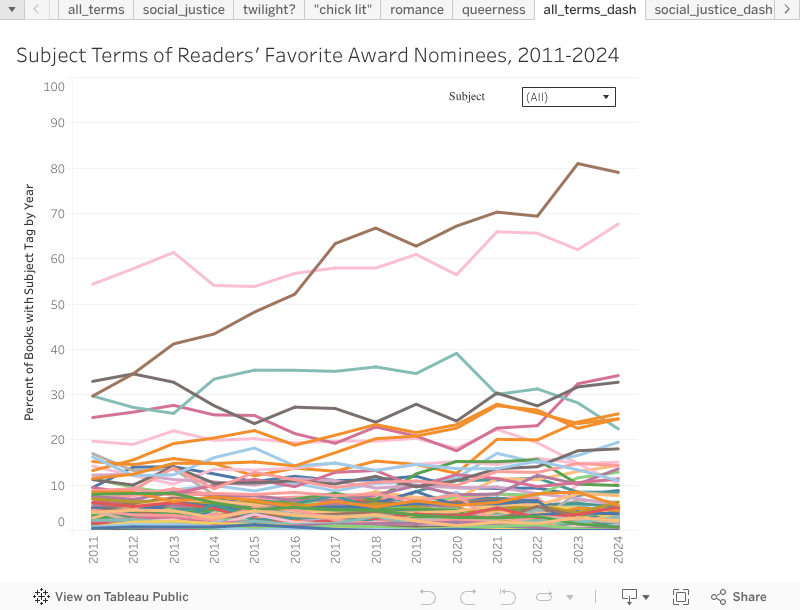
Interested in exploring the data yourself? Right click individual lines or click the checkboxes in the dropdown subject filter below to highlight specific subject tags.
Alternatively, check out the project GitHub page to explore the data and python scripts used in greater detail.
Future Project Directions
In future iterations of the project, I plan to build out tutorials outlining the analysis process in the project GitHub, in order to facilitate project replication. I also plan to recreate the project using messier and larger datasets, to develop a workflow for working with a dataset which is perhaps more realistic to a real world public library's collections metadata.